Image Source
Exploratory Data Analysis
dim(iris)  #Checking dimensions, iris data have 150 observations & 6 features

## [1] 150   6
Checking count of each species
table(iris$Species) #Have equal number of each

##
##     Iris-setosa Iris-versicolor  Iris-virginica
##              50              50              50
Checking iris dataset summary
summary(iris) #Checking data summary, there are no missing values in data

##        Id         SepalLengthCm    SepalWidthCm   PetalLengthCm
##  Min.   :  1.00   Min.   :4.300   Min.   :2.000   Min.   :1.000
##  1st Qu.: 38.25   1st Qu.:5.100   1st Qu.:2.800   1st Qu.:1.600
##  Median : 75.50   Median :5.800   Median :3.000   Median :4.350
##  Mean   : 75.50   Mean   :5.843   Mean   :3.054   Mean   :3.759
##  3rd Qu.:112.75   3rd Qu.:6.400   3rd Qu.:3.300   3rd Qu.:5.100
##  Max.   :150.00   Max.   :7.900   Max.   :4.400   Max.   :6.900
##   PetalWidthCm              Species
##  Min.   :0.100   Iris-setosa    :50
##  1st Qu.:0.300   Iris-versicolor:50
##  Median :1.300   Iris-virginica :50
##  Mean   :1.199
##  3rd Qu.:1.800
##  Max.   :2.500
Checking Iris dataset structure
str(iris) #Iris data have 4 key flower features as numeric type corresponding to 3 Species: setosa,versicolor,virginica

## 'data.frame':    150 obs. of  6 variables:
##  $ Id           : int  1 2 3 4 5 6 7 8 9 10 ...
##  $ SepalLengthCm: num  5.1 4.9 4.7 4.6 5 5.4 4.6 5 4.4 4.9 ...
##  $ SepalWidthCm : num  3.5 3 3.2 3.1 3.6 3.9 3.4 3.4 2.9 3.1 ...
##  $ PetalLengthCm: num  1.4 1.4 1.3 1.5 1.4 1.7 1.4 1.5 1.4 1.5 ...
##  $ PetalWidthCm : num  0.2 0.2 0.2 0.2 0.2 0.4 0.3 0.2 0.2 0.1 ...
##  $ Species      : Factor w/ 3 levels "Iris-setosa",..: 1 1 1 1 1 1 1 1 1 1 ...
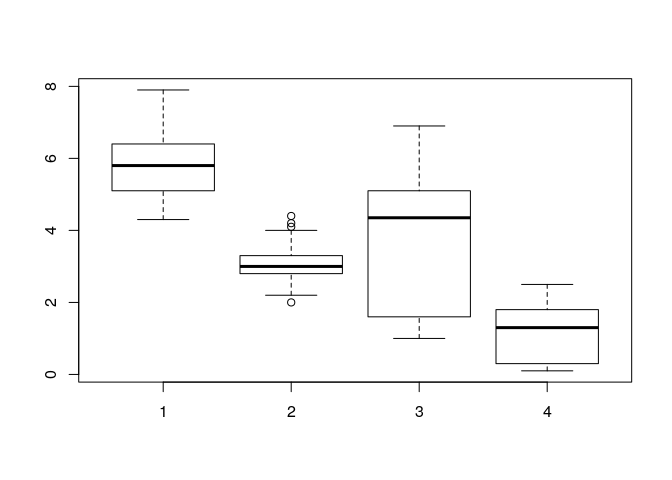
Checking for outliers
boxplot(iris$SepalLengthCm,iris$SepalWidthCm,iris$PetalLengthCm,iris$PetalWidthCm)
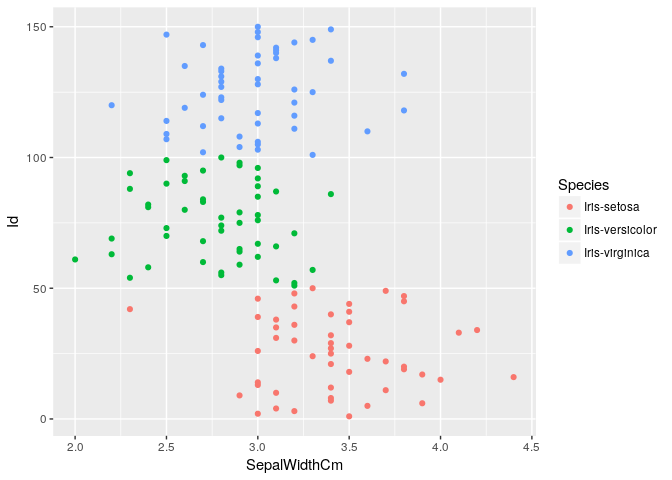
Checking outliers in SepalWidth
ggplot(iris, aes(x=SepalWidthCm, y=Id, color=Species)) + geom_point()
Average length & width by species
temp_df <- iris %>% group_by(Species) %>% summarize(mean(SepalLengthCm),mean(SepalWidthCm),mean(PetalLengthCm),mean(PetalWidthCm))
kable(temp_df,align = 'c',col.names = c('Species','Avg Sepal Length','Avg Sepal Width','Avg Petal Length','Avg Petal Width'))
| Species | Avg Sepal Length | Avg Sepal Width | Avg Petal Length | Avg Petal Width |
|---|---|---|---|---|
| Iris-setosa | 5.006 | 3.418 | 1.464 | 0.244 |
| Iris-versicolor | 5.936 | 2.770 | 4.260 | 1.326 |
| Iris-virginica | 6.588 | 2.974 | 5.552 | 2.026 |
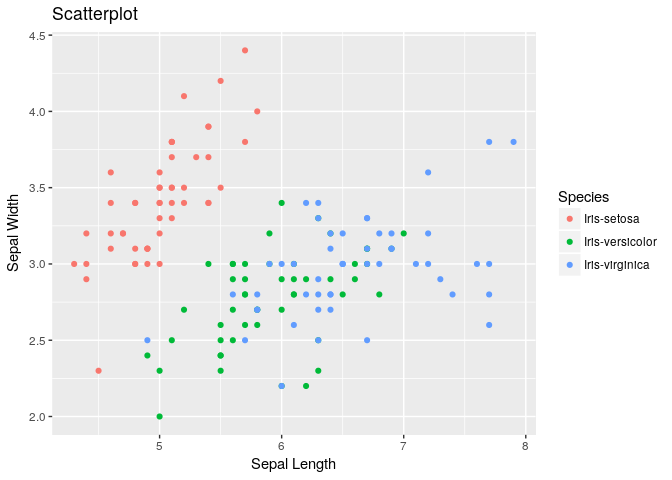
Scatter plot between Sepal Length & Sepal Width:
#plot(iris$SepalLengthCm,iris$SepalWidthCm)
ggplot(iris, aes(x=SepalLengthCm, y=SepalWidthCm, color=Species)) + geom_point() + labs(title="Scatterplot", x="Sepal Length", y="Sepal Width")
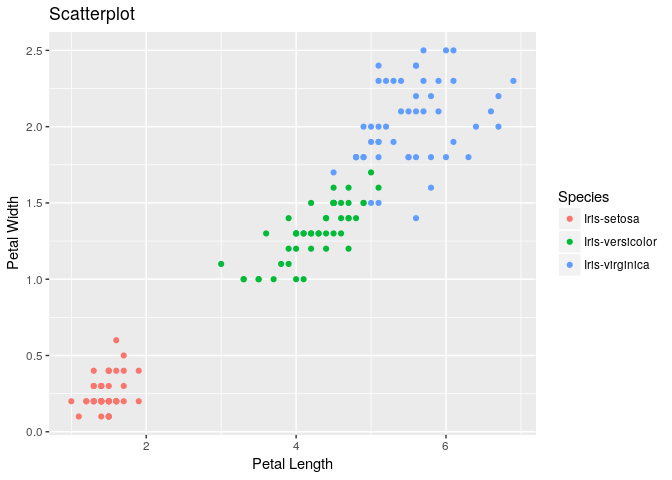
Scatter plot between Petal Length & Petal Width:
ggplot(iris, aes(x=PetalLengthCm, y=PetalWidthCm, color=Species)) + geom_point() + labs(title="Scatterplot", x="Petal Length", y="Petal Width")
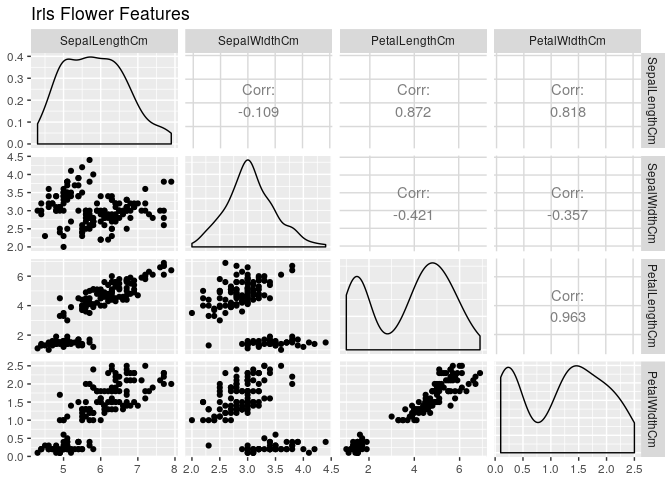
Plotting all numeric features
ggpairs(data=iris,columns=2:5,title="Iris Flower Features",colour='Species')
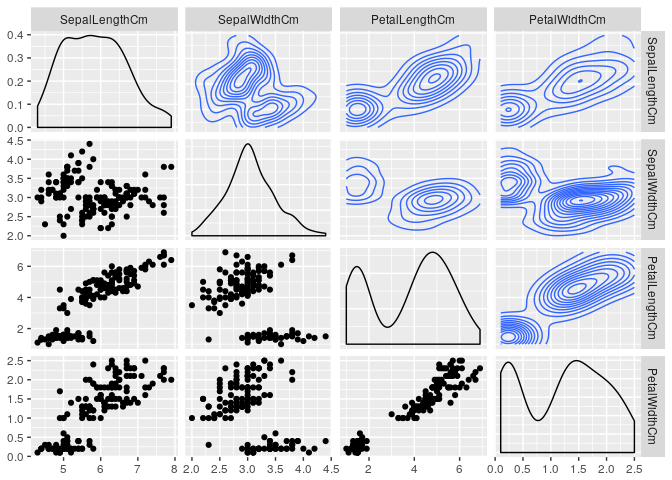
Including Density in plots
ggpairs(data=iris,
             columns=2:5,
             upper = list(continuous = "density"),
             lower = list(combo = "facetdensity"),
             colour = "Species")
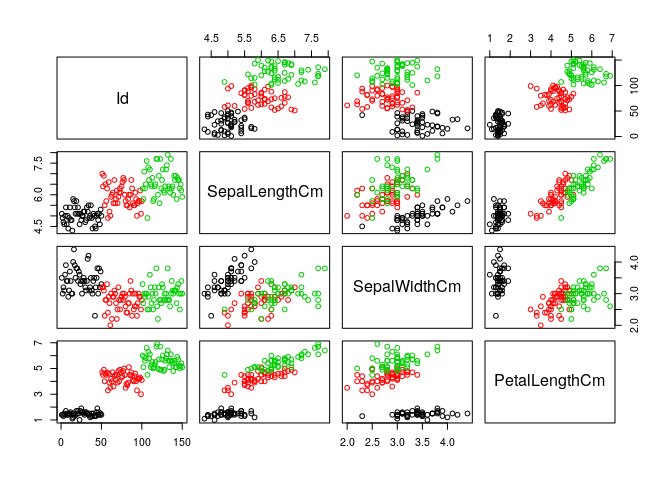
pairs(iris[,1:4], col=iris$Species) #Trying pairs to get distinct colours for each cluster
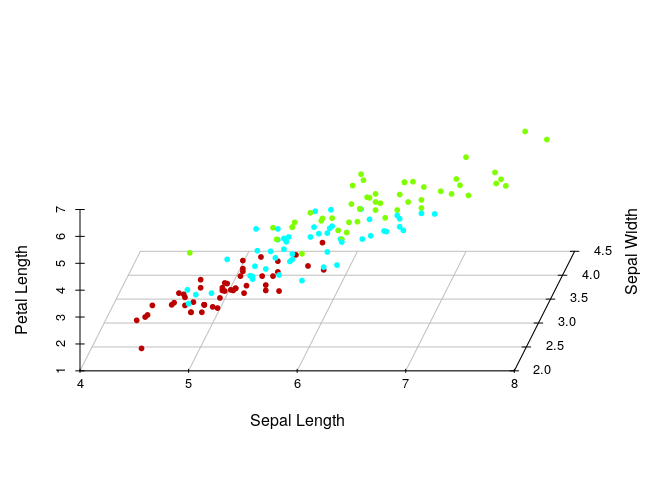
3D visualization with 4 features:
colors <- c("#BB0000", "#00FFFF", "#7FFF00")
colors <- colors[as.numeric(iris$Species)]
scatterplot3d(iris[,2:4], pch=20, color=colors,grid=TRUE, box=FALSE,angle =80,xlab="Sepal Length", ylab="Sepal Width", zlab="Petal Length")
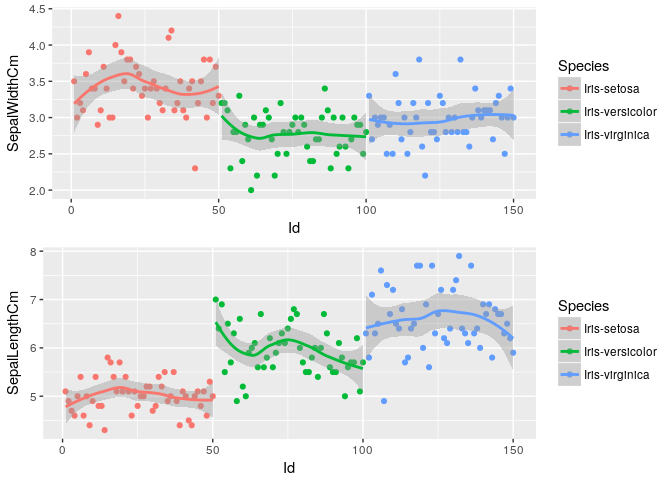
Sepal Dimensions Variation across dataset
p1<-ggplot(iris, aes(x=Id, y=SepalWidthCm, color=Species)) + geom_point() + geom_smooth()
p2<-ggplot(iris, aes(x=Id, y=SepalLengthCm, color=Species)) + geom_point() + geom_smooth()
grid.arrange(p1, p2, nrow=2)
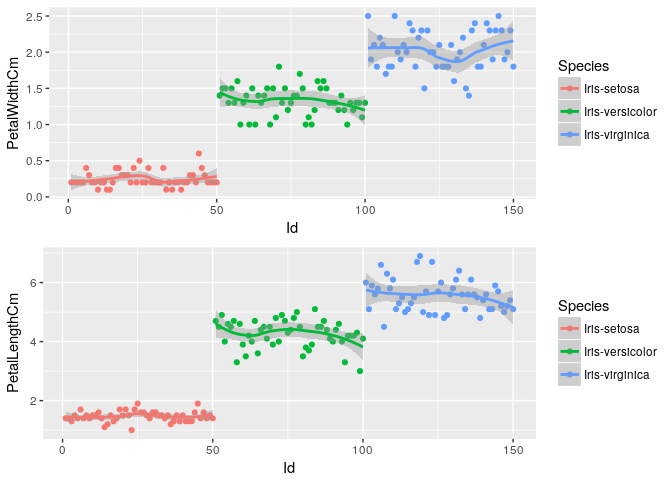
Petal Dimensions Variation across dataset
p3<-ggplot(iris, aes(x=Id, y=PetalWidthCm, color=Species)) + geom_point() + geom_smooth()
p4<-ggplot(iris, aes(x=Id, y=PetalLengthCm, color=Species)) + geom_point() + geom_smooth()
grid.arrange(p3, p4, nrow=2)
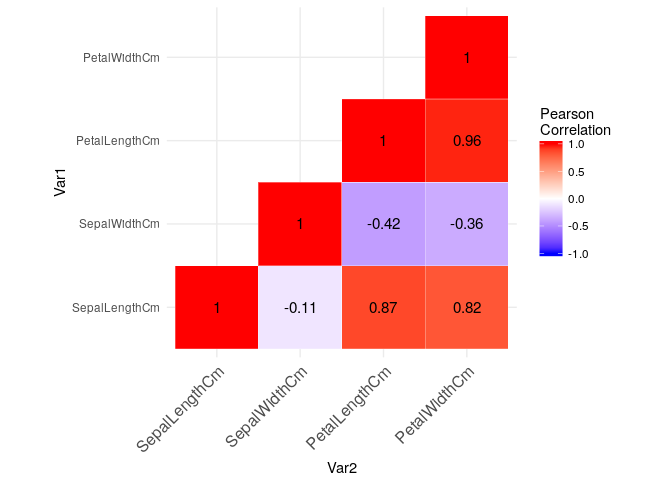
Checking Pearson Correlation heat map among numeric features:
heat-map #check rmd code for details
Testing different machine learning algorithms on iris dataset
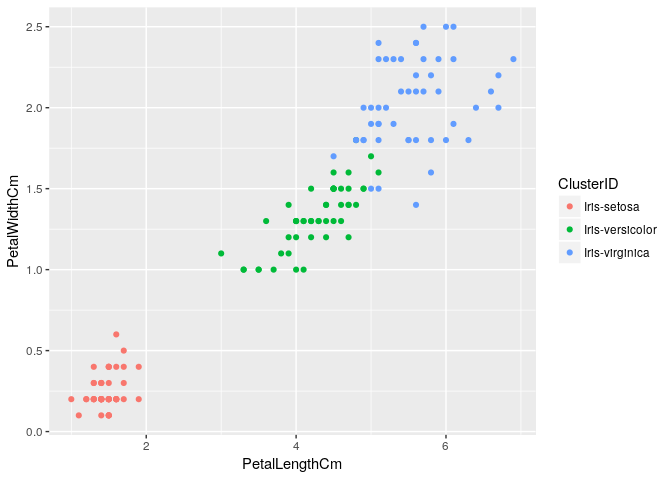
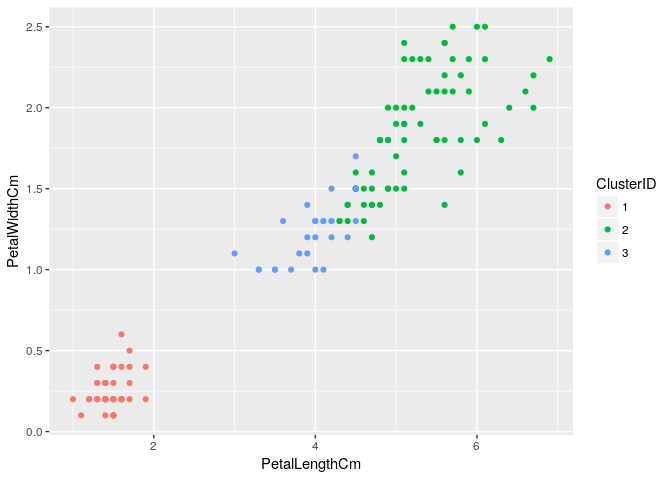
1.Applying k-means clustering
Removing Id as its not required for analysis
iris<-iris[,-c(1)]

iris_subset <-iris #Creating data subset for clustering
clus1 <- kmeans(iris_subset[,-c(5)], centers = 3, iter.max = 50, nstart = 50)

iris_subset <- cbind(iris_subset,clus1$cluster)

iris_subset$`clus1$cluster`<-as.factor(iris_subset$`clus1$cluster`)
colnames(iris_subset)[5]<- "ClusterID"
ggplot(iris_subset, aes(x=PetalLengthCm, y=PetalWidthCm, color=ClusterID)) + geom_point()
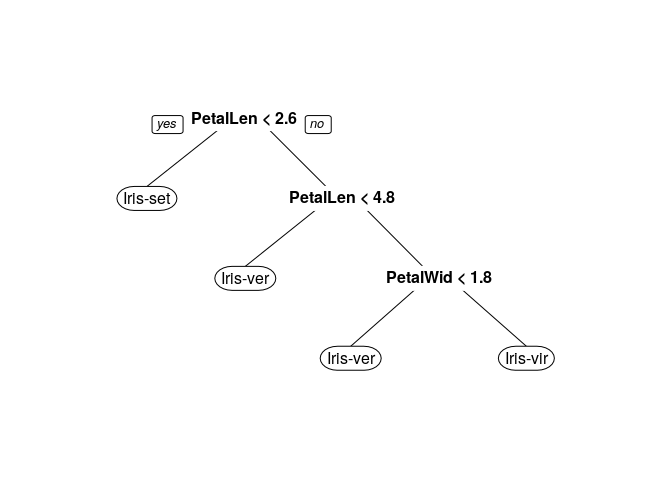
2.Applying Decision Trees
iris_subset <-iris #Creating data subset for classification

#Dividing data in train & test samples
set.seed(123)
split.indices <- sample(nrow(iris_subset), nrow(iris_subset)*0.8, replace = F)
train <- iris_subset[split.indices, ]
test <- iris_subset[-split.indices, ]

tree.model <- rpart(Species ~ .,data = train,method = "class",parms = list(split = "information"))
prp(tree.model)
Making predictions on test set using decision tree model:
tree.predict <- predict(tree.model, test[,-c(5)], type = "class")
confusionMatrix(test$Species, tree.predict)

## Confusion Matrix and Statistics
##
##                  Reference
## Prediction        Iris-setosa Iris-versicolor Iris-virginica
##   Iris-setosa               8               0              0
##   Iris-versicolor           0               9              0
##   Iris-virginica            0               1             12
##
## Overall Statistics
##
##                Accuracy : 0.9667
##                  95% CI : (0.8278, 0.9992)
##     No Information Rate : 0.4
##     P-Value [Acc > NIR] : 5.303e-11
##
##                   Kappa : 0.9492
##  Mcnemar's Test P-Value : NA
##
## Statistics by Class:
##
##                      Class: Iris-setosa Class: Iris-versicolor
## Sensitivity                      1.0000                 0.9000
## Specificity                      1.0000                 1.0000
## Pos Pred Value                   1.0000                 1.0000
## Neg Pred Value                   1.0000                 0.9524
## Prevalence                       0.2667                 0.3333
## Detection Rate                   0.2667                 0.3000
## Detection Prevalence             0.2667                 0.3000
## Balanced Accuracy                1.0000                 0.9500
##                      Class: Iris-virginica
## Sensitivity                         1.0000
## Specificity                         0.9444
## Pos Pred Value                      0.9231
## Neg Pred Value                      1.0000
## Prevalence                          0.4000
## Detection Rate                      0.4000
## Detection Prevalence                0.4333
## Balanced Accuracy                   0.9722
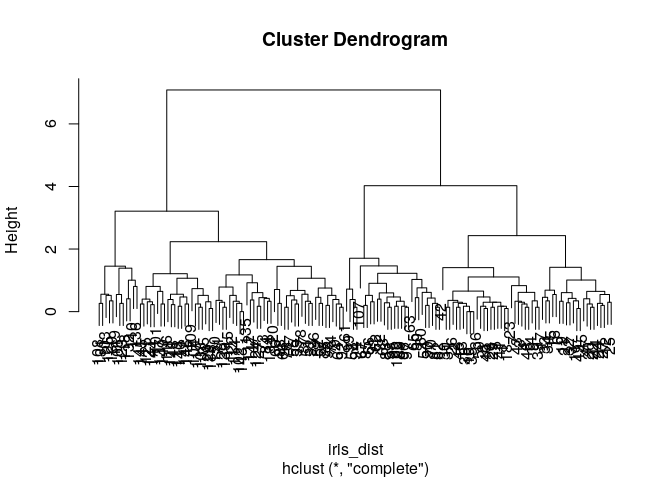
3.Applying Hierarchical Clustering
iris_subset <-iris #Creating data subset for clustering

iris_dist <- dist(iris_subset[,-c(5)]) #calculating distance matrix for features
iris_hclust1<- hclust(iris_dist, method="complete")
plot(iris_hclust1)
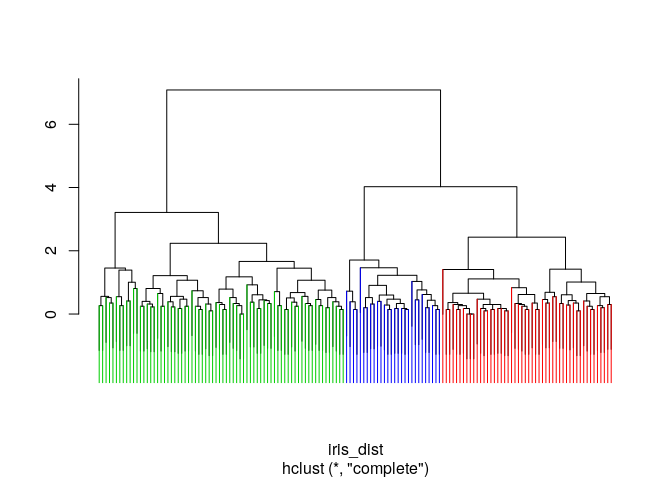
Colored marking of 3 main clusters
clus_cut<-cutree(iris_hclust1, 3)
ColorDendrogram(iris_hclust1, y=clus_cut, labels = names(clus_cut), branchlength = 80)
Getting 3 main clusters & plotting them:
clusterCut <- cutree(iris_hclust1, k=3)
iris_subset <-cbind(iris,clusterCut)
colnames(iris_subset)[6]<- "ClusterID"

iris_subset$ClusterID<-as.factor(iris_subset$ClusterID)
ggplot(iris_subset, aes(x=PetalLengthCm, y=PetalWidthCm, color=ClusterID)) + geom_point()
4.Applying K Nearest Neighbor Algorithm
iris_knn_pred <- knn(train = train[,-c(5)], test[,-c(5)], cl= train$Species,k = 3,prob=TRUE)
confusionMatrix(test$Species, iris_knn_pred)

## Confusion Matrix and Statistics
##
##                  Reference
## Prediction        Iris-setosa Iris-versicolor Iris-virginica
##   Iris-setosa               8               0              0
##   Iris-versicolor           0               9              0
##   Iris-virginica            0               1             12
##
## Overall Statistics
##
##                Accuracy : 0.9667
##                  95% CI : (0.8278, 0.9992)
##     No Information Rate : 0.4
##     P-Value [Acc > NIR] : 5.303e-11
##
##                   Kappa : 0.9492
##  Mcnemar's Test P-Value : NA
##
## Statistics by Class:
##
##                      Class: Iris-setosa Class: Iris-versicolor
## Sensitivity                      1.0000                 0.9000
## Specificity                      1.0000                 1.0000
## Pos Pred Value                   1.0000                 1.0000
## Neg Pred Value                   1.0000                 0.9524
## Prevalence                       0.2667                 0.3333
## Detection Rate                   0.2667                 0.3000
## Detection Prevalence             0.2667                 0.3000
## Balanced Accuracy                1.0000                 0.9500
##                      Class: Iris-virginica
## Sensitivity                         1.0000
## Specificity                         0.9444
## Pos Pred Value                      0.9231
## Neg Pred Value                      1.0000
## Prevalence                          0.4000
## Detection Rate                      0.4000
## Detection Prevalence                0.4333
## Balanced Accuracy                   0.9722
5.Applying Naive Bayes Algorithm
iris_nb = train(iris[,-c(5)],iris$Species,'nb',trControl=trainControl(method='cv',number=10))
iris_nb

## Naive Bayes
##
## 150 samples
##   4 predictor
##   3 classes: 'Iris-setosa', 'Iris-versicolor', 'Iris-virginica'
##
## No pre-processing
## Resampling: Cross-Validated (10 fold)
## Summary of sample sizes: 135, 135, 135, 135, 135, 135, ...
## Resampling results across tuning parameters:
##
##   usekernel  Accuracy   Kappa
##   FALSE      0.9466667  0.92
##    TRUE      0.9533333  0.93
##
## Tuning parameter 'fL' was held constant at a value of 0
## Tuning
##  parameter 'adjust' was held constant at a value of 1
## Accuracy was used to select the optimal model using  the largest value.
## The final values used for the model were fL = 0, usekernel = TRUE
##  and adjust = 1.

table(predict(iris_nb$finalModel,test[,-c(6)])$class,test$Species)

##
##                   Iris-setosa Iris-versicolor Iris-virginica
##   Iris-setosa               8               0              0
##   Iris-versicolor           0               9              1
##   Iris-virginica            0               0             12
6.Applying Support Vector Machine Algorithm
svm_model <- svm(Species ~ ., data=train)
summary(svm_model)

##
## Call:
## svm(formula = Species ~ ., data = train)
##
##
## Parameters:
##    SVM-Type:  C-classification
##  SVM-Kernel:  radial
##        cost:  1
##       gamma:  0.25
##
## Number of Support Vectors:  47
##
##  ( 7 19 21 )
##
##
## Number of Classes:  3
##
## Levels:
##  Iris-setosa Iris-versicolor Iris-virginica
Making predictions on test data:
svm_pred <- predict(svm_model,test[,-c(5)])
table(svm_pred,test[,c(5)])

##
## svm_pred          Iris-setosa Iris-versicolor Iris-virginica
##   Iris-setosa               8               0              0
##   Iris-versicolor           0               9              1
##   Iris-virginica            0               0             12
Thanks for reading, I am a novice in data analysis & still learning, so please provide your valuable feedback on errors & improvements