Here I will be analyzing a graph representing Collaborations among Jazz Musicians. Along the way we will also learn & explore some interesting concepts from Graph Theory using NetworkX package.
About Dataset: Each node is a Jazz musician and an edge denotes that two musicians have played together in a band. You can find more information form data source: http://konect.uni-koblenz.de/networks/arenas-jazz
import networkx as nx
import matplotlib.pyplot as plt
%matplotlib inline
#Reading dataset
interaction_graph = nx.read_edgelist("out.arenas-jazz", create_using = nx.Graph(), nodetype = int)
#Interaction Graph Details
print(nx.info(interaction_graph))
Name:
Type: Graph
Number of nodes: 198
Number of edges: 2742
Average degree:  27.6970
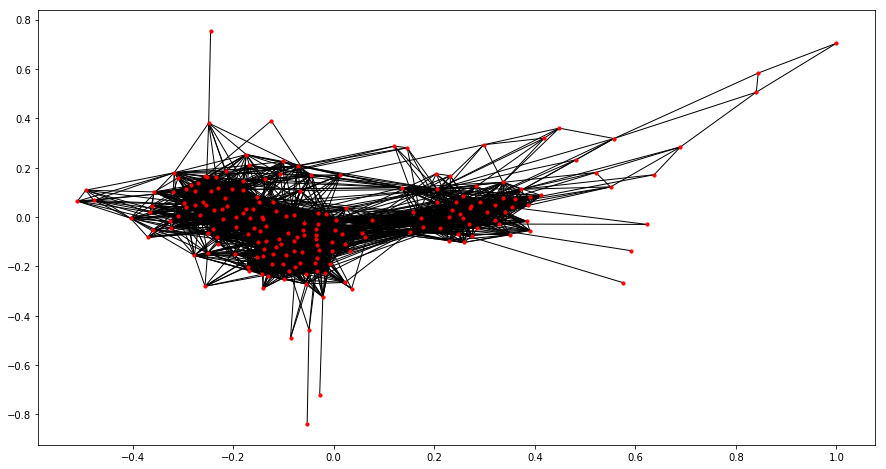
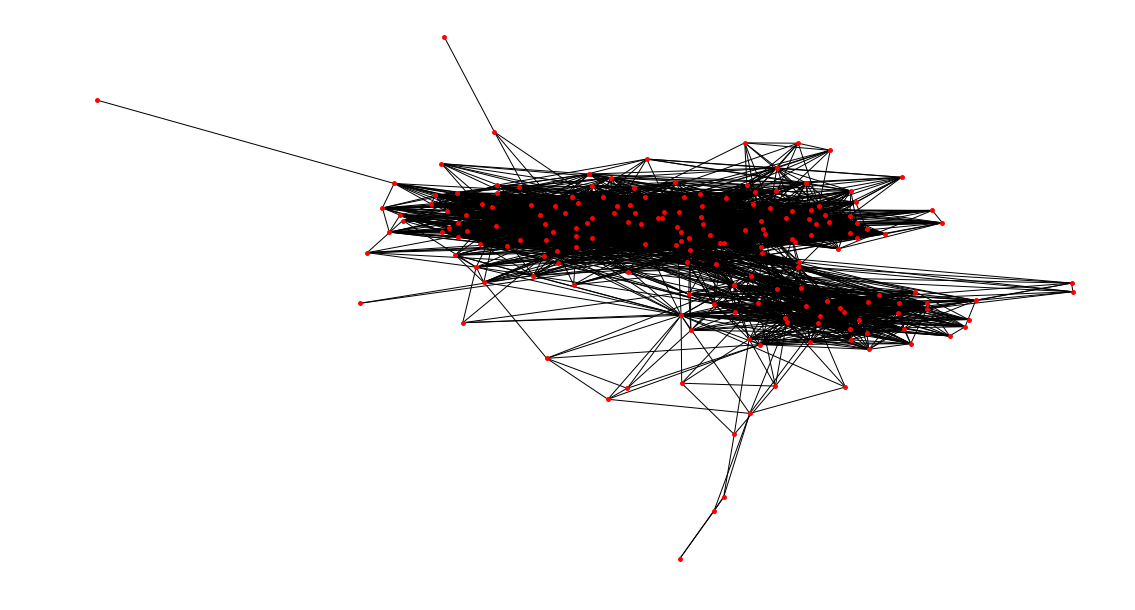
Graph contains data of 198 Jazz musicians \& 2742 collaborations among them.
#Lets plot this graph
plt.figure(figsize=(15,8))
spring_pos = nx.spring_layout(interaction_graph)
nx.draw_networkx(interaction_graph, pos = spring_pos, with_labels = False, node_size = 10)
Finding Maximum Clique
Complete Graph: Complete Graph is a graph in which each pair of graph vertices is connected by an edge.
Clique: A clique of a graph G is a complete subgraph of G.
Maximum Clique: A maximal clique is a clique that cannot be extended by including one more adjacent vertex, meaning it is not a subset of a larger clique. A maximum clique (i.e., clique of largest size in a given graph) is therefore always maximal, but the converse does not hold.
So a maximum clique in our problem is a subset of Jazz Musicians who have all performed with each other. Lets find this clique now.
from networkx.algorithms.approximation import *
maxc = clique.max_clique(interaction_graph)
print("Clique Nodes: ",maxc)
print("Clique Size: ",len(maxc))
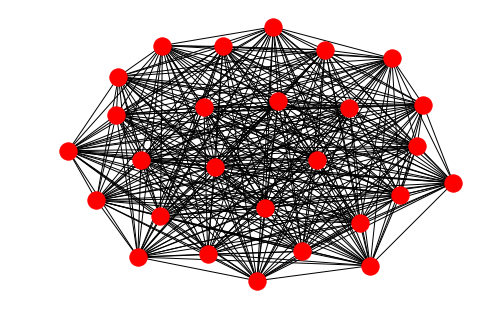
#Our maximum clique have 27 nodes below
Clique Nodes:  {4, 133, 7, 137, 12, 13, 14, 15, 18, 19, 20, 21, 149, 23, 164, 165, 166, 167, 168, 169, 170, 171, 172, 173, 174, 101, 121}
Clique Size:  27
#Lets visualize this subgraph now

nodes = [n for n in maxc]
k = interaction_graph.subgraph(nodes)
nx.draw(k)
Finding Independent Set
Independent Set: An independent vertex set of a graph G is a subset of the vertices such that no two vertices in the subset represent an edge of G.
So an Independent Set will represent set of Jazz Musicians who have not performed with each other. Lets find this set.
max_is = independent_set.maximum_independent_set(interaction_graph)
print("Maximum Indepenset Set: ",max_is)
print("MIS Size: ",len(max_is))
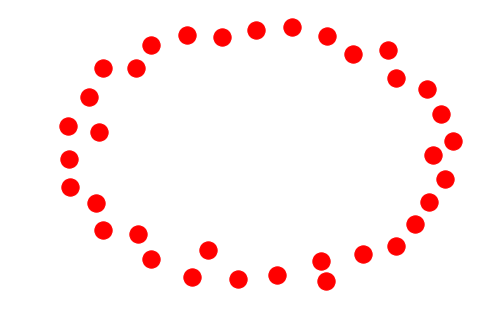
#Our Maximum Independent Set have a set of 35 musicians who have not performed with any one of each other.
Maximum Indepenset Set:  {128, 131, 5, 141, 144, 145, 16, 151, 25, 157, 158, 29, 162, 41, 46, 177, 50, 49, 180, 56, 185, 57, 187, 190, 191, 192, 193, 195, 197, 198, 77, 96, 99, 108, 120}
MIS Size:  35
#Plotting Maximum Independent Set
nodes = [n for n in max_is]
k = interaction_graph.subgraph(nodes)
nx.draw(k)

#Here each node(Jazz Musican) is isolated as there is no edge(Collaboration) among them
Finding Maximal Matching
Minimal Maximal Matching: Given a graph G = (V,E), a matching M in G is a set of pairwise non-adjacent edges; that is, no two edges share a common vertex.
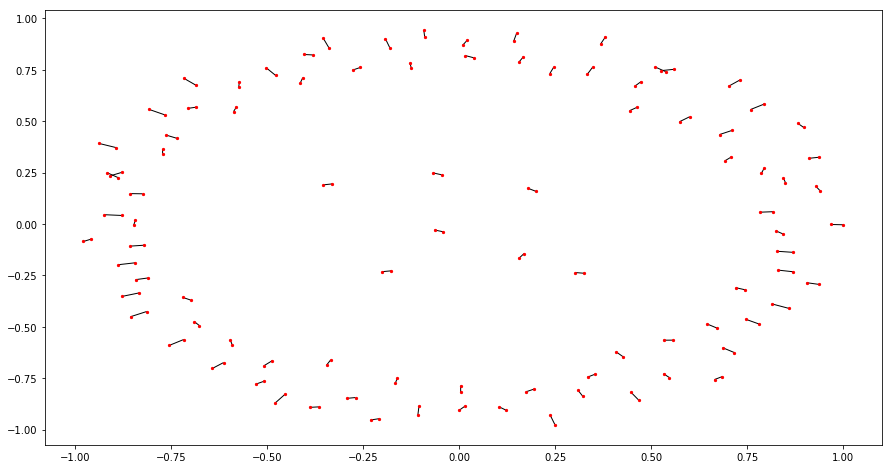
So this set will show distinct collaboration pairs among Jazz Musicians.
mmm = matching.min_maximal_matching(interaction_graph)
print("Minimal Maximal Matching Edges: ",mmm)
print("Total Edges: ",len(mmm))
Minimal Maximal Matching Edges:  {(110, 75), (140, 85), (170, 171), (106, 80), (166, 129), (143, 36), (64, 41), (51, 39), (149, 74), (18, 9), (118, 95), (154, 33), (29, 30), (88, 70), (189, 59), (79, 182), (173, 174), (121, 56), (172, 153), (156, 73), (21, 112), (168, 135), (176, 175), (180, 61), (86, 114), (193, 194), (65, 66), (13, 3), (104, 54), (120, 55), (152, 151), (1, 10), (157, 48), (117, 46), (134, 132), (14, 6), (122, 31), (137, 126), (15, 7), (108, 81), (147, 148), (150, 128), (22, 119), (72, 45), (115, 198), (19, 100), (133, 82), (161, 37), (12, 4), (177, 155), (187, 188), (50, 52), (35, 34), (163, 162), (42, 38), (78, 77), (107, 89), (167, 131), (169, 136), (138, 84), (20, 101), (17, 5), (116, 90), (98, 94), (181, 71), (145, 146), (105, 26), (16, 8), (139, 32), (68, 43), (125, 27), (24, 103), (11, 2), (164, 87), (44, 63), (165, 97), (23, 102), (160, 93), (123, 67), (183, 53), (92, 91), (111, 83), (124, 28), (60, 40), (178, 179), (130, 47), (109, 62), (58, 57), (141, 142), (159, 76), (96, 113), (185, 186)}
Total Edges:  92
#Plotting Minimal Maximal Matching Graph
plt.figure(figsize=(15,8))
G=nx.Graph()
G.add_edges_from(list(mmm))

spring_pos = nx.spring_layout(G)
nx.draw_networkx(G, pos = spring_pos, with_labels = False, node_size = 5)
Finding Vertex Cover
Vertex Cover: A Vertex Cover is a subset of nodes such that each edge in the graph is incident to at least one node in the subset.
So vertex cover will show us all jazz musicians who together were part of all collaborations
vc = vertex_cover.min_weighted_vertex_cover(interaction_graph)
print("Vertices in Vertex Cover: ",vc)
print("Total Vertices: ",len(vc))
Vertices in Vertex Cover:  {1, 2, 3, 4, 5, 6, 7, 8, 9, 10, 11, 12, 13, 14, 15, 16, 17, 18, 19, 20, 21, 22, 23, 24, 26, 27, 28, 29, 30, 31, 32, 33, 34, 35, 36, 37, 38, 39, 40, 41, 42, 43, 44, 45, 46, 47, 48, 50, 51, 52, 53, 54, 55, 56, 57, 58, 59, 60, 61, 62, 63, 64, 65, 66, 67, 68, 70, 71, 72, 73, 74, 75, 76, 77, 78, 79, 80, 81, 82, 83, 84, 85, 86, 87, 88, 89, 90, 91, 92, 93, 94, 95, 96, 97, 98, 100, 101, 102, 103, 104, 105, 106, 107, 108, 109, 110, 111, 112, 113, 114, 115, 116, 117, 118, 119, 120, 121, 122, 123, 124, 125, 126, 128, 129, 130, 131, 132, 133, 134, 135, 136, 137, 138, 139, 140, 141, 142, 143, 145, 146, 147, 148, 149, 150, 151, 152, 153, 154, 155, 156, 157, 159, 160, 161, 162, 163, 164, 165, 166, 167, 168, 169, 170, 171, 172, 173, 174, 175, 176, 177, 178, 179, 180, 181, 182, 183, 185, 186, 187, 188, 189, 193, 194, 198}
Total Vertices:  184
plt.figure(figsize=(15,8))
nodes = [n for n in vc]
k = interaction_graph.subgraph(nodes)
nx.draw(k, with_labels = False, node_size = 15)
Finding Vertex Degree
Vertex Degree: The degree of a graph vertex V of a graph G = (V,E) is the number of graph edges(E) which touch V.
So Vertex Degree will represent number of interactions or collaborations each Jazz Musician had.
interaction_graph.degree()
DegreeView({1: 23, 10: 42, 11: 40, 12: 46, 13: 60, 14: 49, 15: 49, 16: 23, 17: 20, 18: 60, 19: 56, 2: 21, 20: 75, 21: 43, 22: 10, 23: 74, 24: 45, 3: 29, 4: 43, 5: 12, 6: 23, 7: 96, 8: 20, 9: 26, 120: 17, 121: 43, 122: 41, 123: 39, 124: 31, 125: 52, 67: 100, 130: 19, 145: 8, 146: 9, 147: 8, 148: 24, 149: 48, 150: 38, 157: 11, 159: 29, 160: 25, 101: 55, 112: 48, 128: 41, 133: 51, 137: 46, 152: 30, 164: 39, 165: 40, 166: 34, 167: 34, 168: 37, 169: 32, 170: 31, 171: 32, 172: 33, 173: 34, 174: 33, 177: 14, 178: 14, 179: 18, 153: 27, 155: 39, 100: 44, 102: 31, 103: 29, 104: 23, 105: 35, 106: 23, 107: 27, 108: 23, 109: 59, 110: 31, 111: 53, 116: 27, 117: 55, 118: 28, 119: 46, 127: 13, 138: 21, 139: 37, 140: 20, 154: 36, 191: 6, 26: 25, 27: 46, 28: 39, 48: 24, 54: 42, 55: 37, 74: 56, 75: 45, 76: 36, 80: 57, 81: 27, 83: 26, 84: 42, 85: 25, 86: 32, 87: 33, 89: 53, 90: 62, 92: 9, 93: 59, 95: 27, 96: 26, 97: 41, 98: 28, 91: 30, 94: 24, 134: 16, 192: 10, 114: 39, 158: 19, 88: 29, 187: 12, 188: 8, 189: 17, 56: 31, 135: 18, 176: 13, 193: 14, 126: 20, 131: 20, 132: 13, 31: 41, 25: 3, 115: 15, 144: 13, 62: 52, 113: 20, 35: 46, 70: 54, 29: 4, 30: 7, 32: 45, 33: 40, 143: 5, 78: 3, 79: 4, 141: 6, 142: 5, 161: 14, 180: 5, 183: 6, 184: 6, 34: 16, 36: 25, 37: 31, 42: 39, 50: 13, 51: 28, 52: 31, 53: 19, 58: 16, 60: 40, 61: 33, 64: 16, 65: 17, 66: 40, 68: 31, 69: 17, 72: 12, 156: 22, 181: 6, 190: 3, 196: 2, 38: 29, 39: 19, 40: 19, 41: 23, 43: 22, 44: 23, 45: 24, 46: 24, 47: 31, 57: 17, 59: 20, 63: 18, 71: 20, 73: 25, 49: 1, 185: 7, 186: 7, 129: 19, 136: 19, 82: 23, 99: 13, 151: 2, 194: 18, 197: 1, 182: 5, 77: 2, 163: 4, 198: 1, 175: 9, 162: 1, 195: 1})
#Lets Find the musician who have maximum number of collaborations using concept of vertex degree
max_degree=0
vertex=0
for i in range(1,198):
    if(int(interaction_graph.degree(i))>max_degree):
        max_degree = int(interaction_graph.degree(i))
        vertex = i

print("Vertex",vertex,"have degree",max_degree)

#So Musician number 67 have collaborated with 100 other Jazz musicians
Vertex 67 have degree 100
Finding Pendent Vertices
Pendent Vertex: A vertex of a graph is said to be pendant if its neighborhood contains exactly one vertex.
So a Jazz Musician who have only collaborated once is a Pendent Vertex in our interaction graph. Lets find these musicians.
pendent_vertices = [x for x in interaction_graph.nodes() if interaction_graph.degree(x)==1]
pendent_vertices

#These 5 musicians have only collaborated once.
[49, 197, 198, 162, 195]
Thanks for reading, I will share more on graph analysis and algorithms with networkx soon.