The purpose of visualization is insight, not pictures.
– Ben Shneiderman
Visualizing Significant Earthquakes Using Leaflet
Interactive visualizations using leaflet package in R. Took dataset of significant earthquakes between 1965 to 2016 from kaggle. This dataset was compiled by National Earthquake Information Center (NEIC). This dataset includes a record of the date, time, location, depth, magnitude, and source of every earthquake with a reported magnitude 5.5 or higher since 1965.
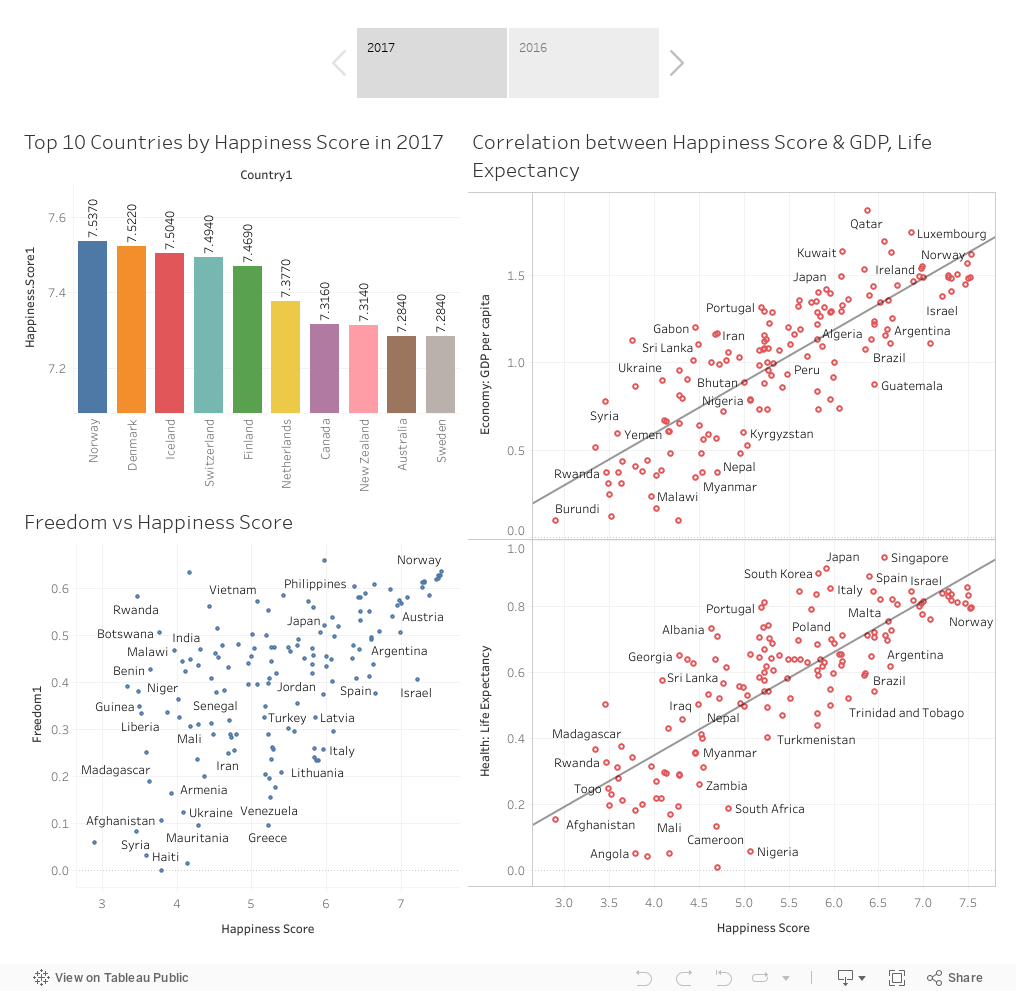
Happiness Score Analysis
San Francisco Kidnapping Crime Spatial Analysis
Interactive visualizations using leaflet package in R. This dataset contains incidents derived from SFPD Crime Incident Reporting system. The data ranges from 1/1/2003 to 5/13/2015.
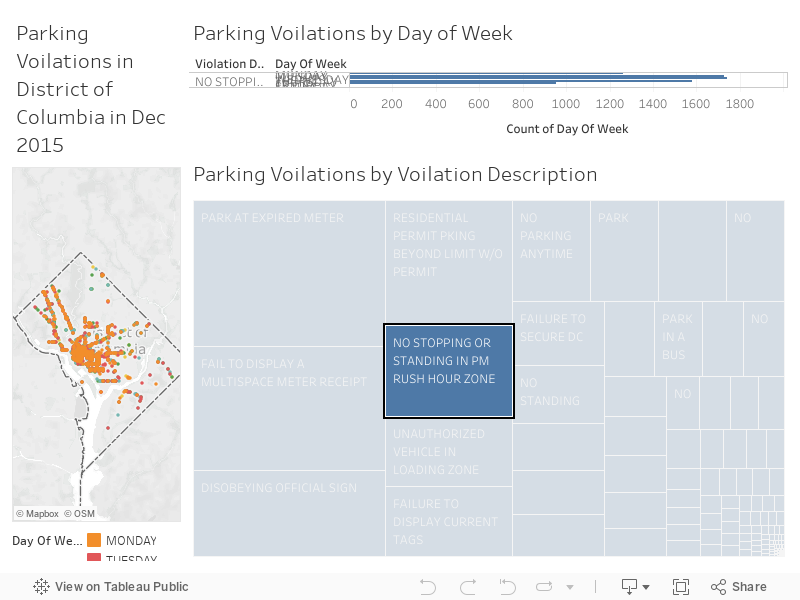
Parking Voilations in District of Columbia in Dec 2015
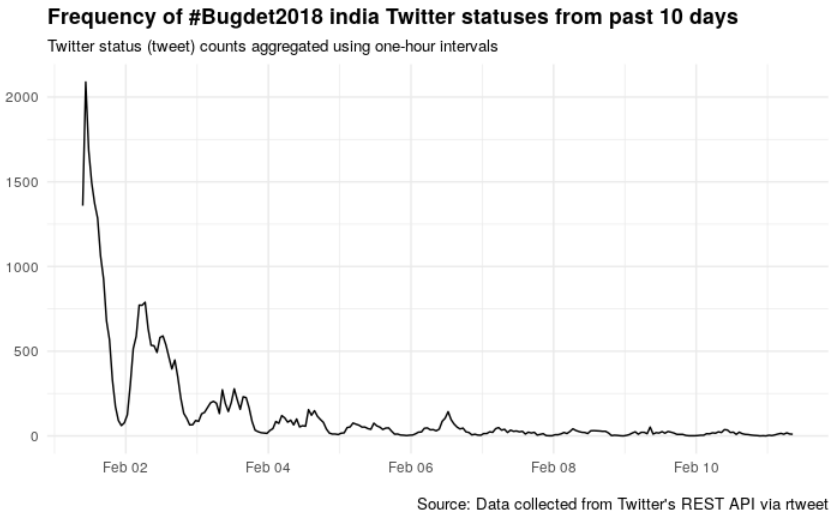
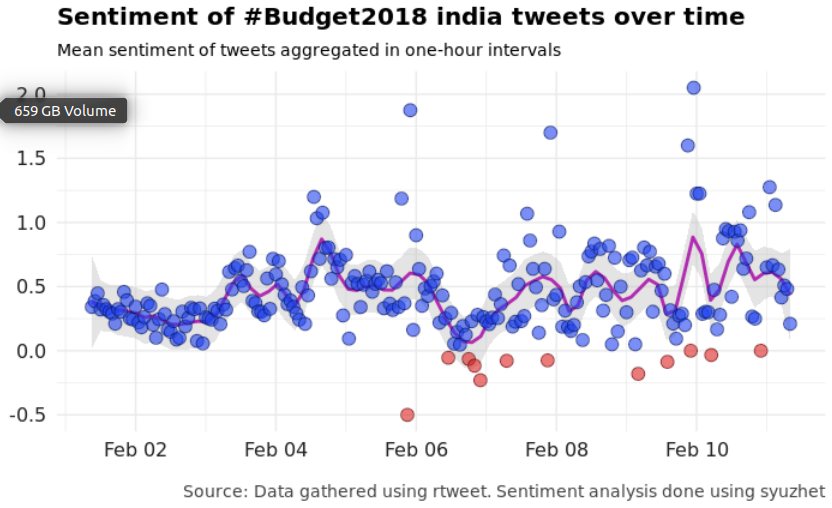
Indian Budget 2018 Tweets Frequency & Sentiments Visualization
Indian budget was announced on 1 February 2017. These visualizations are based on collection of ~30000 tweets on hashtag #Budget2018. Tweets were collected using rtweet package & sentiment analysis was done using syuzhet package in R.
Note: This is only a learning exercise to explore twitter sentiment analysis using rtweet & syuzhet packages. It does not reflect my views or public opinion in general on Indian Budget 2018.
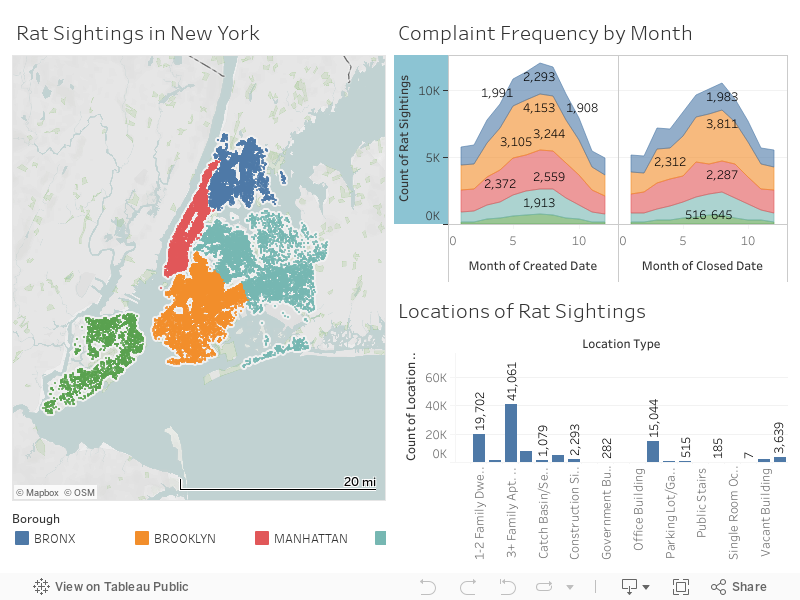
NYC Rat Sightings