Here I will be developing a model for prediction of handwritten digits using famous MNIST dataset. I will build first model using Support Vector Machine(SVM) followed by an improved approach using Principal Component Analysis(PCA).
Fetching Data
#Loading train & test data, the datasets were obtained from kaggle: https://www.kaggle.com/c/digit-recognizer/data
mnist <- read.csv("train.csv")
mnist_test <- read.csv("test.csv")
Checking dataset dimensions
dim(mnist)

## [1] 42000   785

#train dataset have 42000 images & 785 columns(784 representing 28x28 pixels image, 1 representing image class)

dim(mnist_test)

## [1] 28000   784

#train dataset have 28000 images & 784 columns(784 representing 28x28 pixels image)
Lets check distribution percentage of each digit in train dataset
table(mnist$label)/nrow(mnist) *100

##
##         0         1         2         3         4         5         6
##  9.838095 11.152381  9.945238 10.359524  9.695238  9.035714  9.850000
##         7         8         9
## 10.478571  9.673810  9.971429

#Have uniform distribution of each digit
Visualizing a digit in data
digit <- matrix(as.numeric(mnist[4,-1]), nrow = 28)
image(digit, col = grey.colors(255))
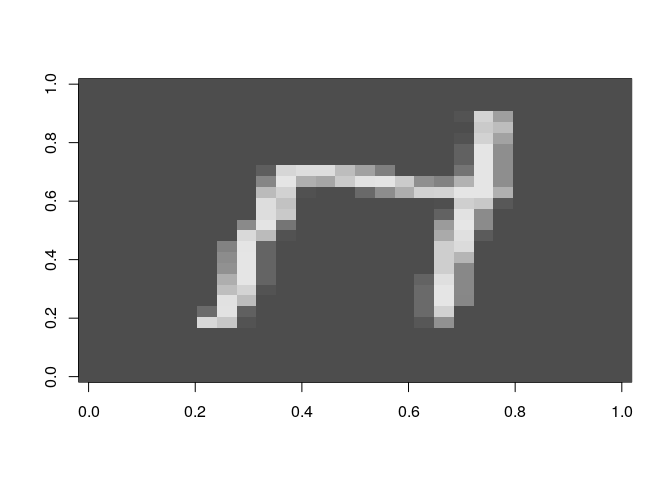
#This is how a typical digit looks in our dataset, image is flipped
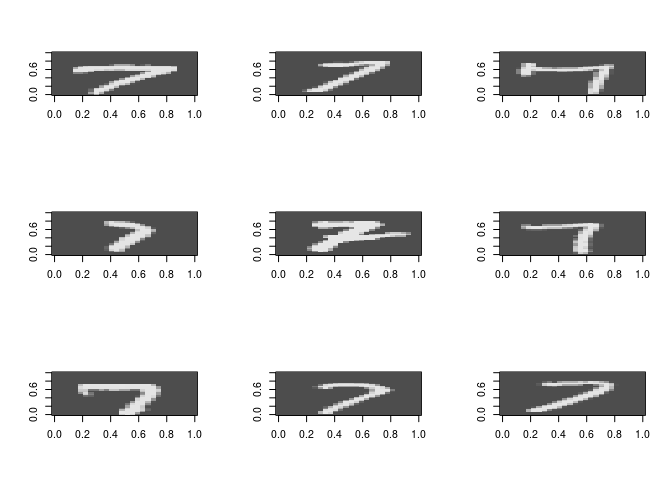
Some more images of same digit to show the variations in handwriting
mnist_copy<-mnist

mnist_copy_7 <- mnist_copy[mnist_copy$label == 7, ]
flip <- function(matrix){
  apply(matrix, 2, rev)
}
#Shows 9 diffrent ways people write digit 7
par(mfrow=c(3,3))
for (i in 10:18){
  digit <- flip(matrix(rev(as.numeric(mnist_copy_7[i,-c(1, 786)])), nrow = 28)) #shows different styles of digit
  image(digit, col = grey.colors(255))
}
Preparing to build the model
#Lets first convert our class label to factor or categorical type
mnist$label <-factor(mnist$label)

#Dividing data into training & validation sets
set.seed(100)
indices = sample.split(mnist$label, SplitRatio = 0.2)
train = mnist[indices,]
test = mnist[-indices,]
Building a model for predicting handwritten image using SVM
#I have skipped hyper-parameter tunning here as its compute intensive
Model_RBF <- ksvm(label~., data = train, scale = FALSE, kernel = "rbfdot")

## Warning in .local(x, ...): Variable(s) `' constant. Cannot scale data.

Eval_RBF<- predict(Model_RBF, test)
#confusion matrix - RBF Kernel
confusionMatrix(Eval_RBF,test$label)

## Confusion Matrix and Statistics
##
##           Reference
## Prediction    0    1    2    3    4    5    6    7    8    9
##          0 4081    0   17    6    5   19   28    6    7   18
##          1    0 4612   14   15    9    7    1   34   44   11
##          2    8   23 4023   69   20   18    4   36   18   11
##          3    2   14   15 4079    0   59    0    2   41   58
##          4    6    7   27    2 3925    8   11   25   25   66
##          5   10    6    7   79    3 3631   24    4   45   15
##          6   13    1   10    8   13   31 4063    0   12    1
##          7    1    5   31   23    5    4    0 4208   19   59
##          8   10   11   28   47    1    9    6    4 3825   30
##          9    1    4    5   23   91    9    0   82   27 3919
##
## Overall Statistics
##
##                Accuracy : 0.9611
##                  95% CI : (0.9592, 0.9629)
##     No Information Rate : 0.1115
##     P-Value [Acc > NIR] : < 2.2e-16
##
##                   Kappa : 0.9568
##  Mcnemar's Test P-Value : NA
##
## Statistics by Class:
##
##                      Class: 0 Class: 1 Class: 2 Class: 3 Class: 4 Class: 5
## Sensitivity           0.98766   0.9848  0.96313  0.93749  0.96390  0.95679
## Specificity           0.99720   0.9964  0.99453  0.99493  0.99533  0.99495
## Pos Pred Value        0.97468   0.9716  0.95106  0.95527  0.95685  0.94953
## Neg Pred Value        0.99865   0.9981  0.99592  0.99279  0.99612  0.99570
## Prevalence            0.09838   0.1115  0.09945  0.10360  0.09695  0.09036
## Detection Rate        0.09717   0.1098  0.09579  0.09712  0.09345  0.08645
## Detection Prevalence  0.09969   0.1130  0.10072  0.10167  0.09767  0.09105
## Balanced Accuracy     0.99243   0.9906  0.97883  0.96621  0.97962  0.97587
##                      Class: 6 Class: 7 Class: 8 Class: 9
## Sensitivity           0.98211   0.9561  0.94142  0.93577
## Specificity           0.99765   0.9961  0.99615  0.99360
## Pos Pred Value        0.97856   0.9662  0.96323  0.94184
## Neg Pred Value        0.99804   0.9949  0.99374  0.99289
## Prevalence            0.09850   0.1048  0.09674  0.09972
## Detection Rate        0.09674   0.1002  0.09107  0.09331
## Detection Prevalence  0.09886   0.1037  0.09455  0.09907
## Balanced Accuracy     0.98988   0.9761  0.96879  0.96468
Lets try PCA now
#Reducing features using PCA
mnist_norm<-as.matrix(mnist[,-1])/255
mnist_norm_cov <- cov(mnist_norm)
pca <- prcomp(mnist_norm_cov)
trainlabel <- mnist[,1]

#Checking relationship between number of Pricipal Components & Variance
vexplained <- as.data.frame(pca$sdev^2/sum(pca$sdev^2))
vexplained <- cbind(c(1:784),vexplained,cumsum(vexplained[,1]))
colnames(vexplained) <- c("No_of_Principal_Components","Individual_Variance_Explained","Cumulative_Variance_Explained")

#Plot between Cumulative Variance & Principal Components
plot(vexplained$No_of_Principal_Components,vexplained$Cumulative_Variance_Explained, xlim = c(0,150),type='b',pch=16,xlab = "Principal Componets",ylab = "Cumulative Variance Explained",main = 'Principal Components vs Cumulative Variance Explained')
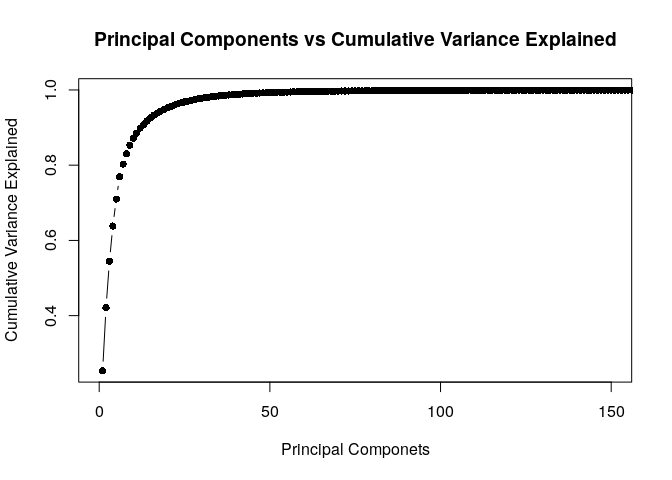
Table showing Cumulative Variance & Principal Components
vexplainedsummary <- vexplained[seq(0,150,5),]
kable(vexplainedsummary)
| No_of_Principal_Components | Individual_Variance_Explained | Cumulative_Variance_Explained | |
|---|---|---|---|
| 5 | 5 | 0.0716813 | 0.7099512 |
| 10 | 10 | 0.0180431 | 0.8711603 |
| 15 | 15 | 0.0081399 | 0.9256031 |
| 20 | 20 | 0.0043323 | 0.9527282 |
| 25 | 25 | 0.0025642 | 0.9682100 |
| 30 | 30 | 0.0015399 | 0.9779664 |
| 35 | 35 | 0.0010429 | 0.9840624 |
| 40 | 40 | 0.0007112 | 0.9880982 |
| 45 | 45 | 0.0004829 | 0.9909898 |
| 50 | 50 | 0.0003355 | 0.9929776 |
| 55 | 55 | 0.0002571 | 0.9944191 |
| 60 | 60 | 0.0001985 | 0.9955116 |
| 65 | 65 | 0.0001498 | 0.9963654 |
| 70 | 70 | 0.0001163 | 0.9970027 |
| 75 | 75 | 0.0000902 | 0.9975132 |
| 80 | 80 | 0.0000663 | 0.9978984 |
| 85 | 85 | 0.0000573 | 0.9982081 |
| 90 | 90 | 0.0000468 | 0.9984654 |
| 95 | 95 | 0.0000382 | 0.9986709 |
| 100 | 100 | 0.0000327 | 0.9988451 |
| 105 | 105 | 0.0000269 | 0.9989884 |
| 110 | 110 | 0.0000218 | 0.9991066 |
| 115 | 115 | 0.0000188 | 0.9992046 |
| 120 | 120 | 0.0000161 | 0.9992906 |
| 125 | 125 | 0.0000141 | 0.9993654 |
| 130 | 130 | 0.0000120 | 0.9994293 |
| 135 | 135 | 0.0000108 | 0.9994860 |
| 140 | 140 | 0.0000090 | 0.9995354 |
| 145 | 145 | 0.0000080 | 0.9995773 |
| 150 | 150 | 0.0000071 | 0.9996148 |
#Note: Variance till Number of Principal Components 45 is 0.9909898
Applying SVM on training set and calculating accuracy using top 45 principal components
mnist_final <- as.matrix(mnist[,-1]) %*% pca$x[,1:45]
trainlabel <- as.factor(trainlabel)
svm.model.final <- svm(mnist_final,trainlabel,cost = 2)
predictionfinaltrain <- predict(svm.model.final,mnist_final)
correcttrainfinal <- predictionfinaltrain==trainlabel
Accuracytrainfinal <- (sum(correcttrainfinal)/nrow(mnist_final))*100
Accuracytrainfinal #99.70 %

## [1] 99.70238
Predicting mnist test data labels using above model
mnist_test_pca<-as.matrix(mnist_test) %*% pca$x[,1:45]
mnist_predictions<-predict(svm.model.final,mnist_test_pca)
mnist_test$predicted_labels<-mnist_predictions
mnist_test$predicted_labels[1:10]
## [1] 2 0 9 9 3 7 0 3 0 3
## Levels: 0 1 2 3 4 5 6 7 8 9
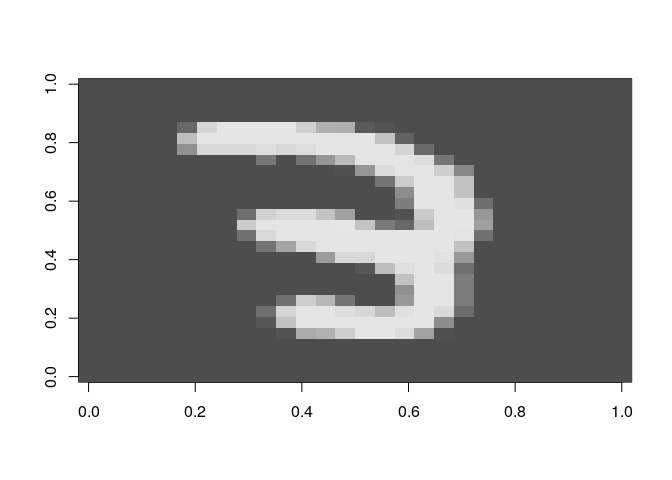
#Testing a predicted label manually, Digit 3 on 8th record is correctly predicted.
digit <- matrix(as.numeric(mnist_test[8,-785]), nrow = 28)
image(digit, col = grey.colors(255))
#I get a decent accuracy of 98.4% using this model on kaggle, but can we do better?